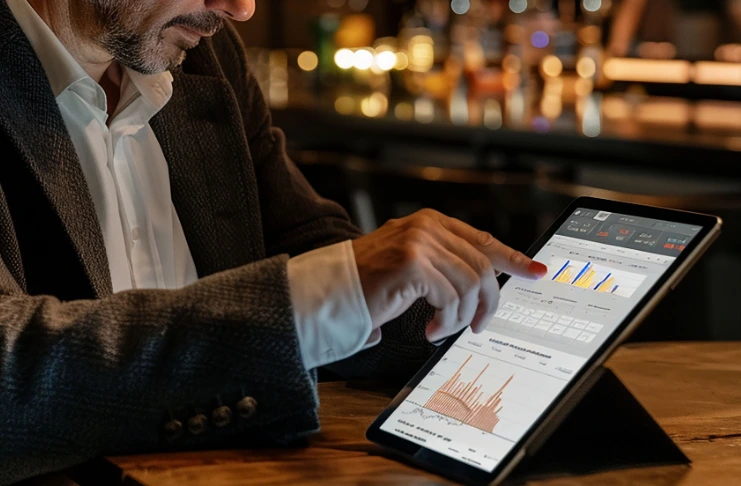
In the competitive and fast-paced restaurant industry, making informed decisions is the difference between thriving and barely surviving. Restaurant reports provide the critical data insights needed to understand your business’s performance, identify areas for improvement, and capitalize on opportunities for growth. Whether you’re running a small café or managing a chain of restaurants, effective reporting gives you the visibility needed to make smart, strategic decisions.
Restaurant reports serve as the backbone of data-driven decision-making in the food service industry. By leveraging comprehensive restaurant reports, restaurant performance reports, and advanced restaurant analytics and reporting, restaurant owners and managers can transform raw data into actionable insights that drive profitability, operational efficiency, and customer satisfaction. Reporting for restaurants ensures that every aspect of the business is optimized, from sales tracking to customer behavior analysis.
Why Restaurant Reports Matter More Than Ever
The restaurant landscape has changed dramatically in recent years. With rising costs, changing consumer preferences, and fierce competition, restaurants can no longer rely on gut instinct alone. According to recent industry studies, restaurants that regularly analyze performance data are 30% more likely to maintain profitability during economic downturns than those operating without data-driven insights.
Investing time in understanding your restaurant reports isn’t just good practice—it’s essential for survival in an industry with notoriously thin margins. Restaurants typically operate on profit margins between 3-5%, making data-driven optimization essential for long-term success.
Consider this: Would you drive a car with just a few clicks on covered dashboard? Without visibility into your speed, fuel level, or engine status? Running a restaurant without comprehensive reports is just as risky. Read ahead to know the key restaurant reports and small quick tips to make your restaurant successful.
Key Restaurant Reports Every Owner Should Monitor
1. Sales Performance Report
At the foundation of restaurant reporting are your sales numbers. Following pointers break down the sales report:
- Daily, weekly, monthly, and yearly sales trends
- Sales by menu category and individual items
- Peak hours and slow periods
- Average check size
- Comparison data against previous periods
Modern reporting systems can automatically highlight your top-performing items and suggest menu engineering strategies based on popularity and profitability metrics. By implementing tabletop tablets to collect customer data and feedback, Applebee’s gathered insights from nearly 6 million guests. This data informed the relaunch of their To-Go option, leading to a 7% increase in customer satisfaction and a doubling of its annual revenue.
2. Labor Cost Reports
Labor typically represents 25-35% of a restaurant business’s total expenses. Detailed labor reports help you:
- Track labor as a percentage of sales
- Monitor overtime hours
- Identify scheduling inefficiencies
- Compare productivity across shifts
- Maintain optimal staff-to-guest ratios
Look for patterns in your labor costs against sales volumes. Are certain shifts consistently overstaffed? Are your labor percentages climbing without corresponding sales increases?
3. Food Cost & Inventory Reports
Food costs often make or break restaurant profitability. Essential inventory reporting includes:
- Item-level food cost percentages
- Theoretical vs. actual inventory usage
- Waste tracking and analysis
- Vendor price comparison
- Inventory turnover rates
Taco Bell, a prominent fast-food chain, has recently introduced AI-powered tools aimed at enhancing restaurant management, including inventory management. These tools assist managers by addressing scheduling issues and optimizing inventory, potentially leading to cost reductions.
4. Customer Satisfaction & Feedback Reports

Understanding your guests’ experiences provides invaluable insights:
- Online review aggregation and sentiment analysis
- Customer satisfaction scores
- Complaint categories and resolution tracking
- Net Promoter Score (NPS) trends
- Loyalty program participation metrics
Restaurants that systematically track and respond to customer feedback typically see a 15-20% increase in repeat business over time according to reports.
INDUSTRY INSIGHT
The statistic about restaurants seeing a 15-20% increase in repeat business by systematically tracking customer feedback is derived from several industry studies, including:
| According to a Harvard Business Review study, businesses that implement systematic customer feedback programs see an average increase in customer retention rates of 16% compared to those that don’t have formal feedback mechanisms. |
When restaurants implement comprehensive feedback tracking systems, they benefit in multiple ways:
- Identifying recurring issues: Systematic categorization of feedback helps detect patterns that might be missed in anecdotal observations
- Service recovery opportunities: Prompt response to negative experiences can transform detractors into loyal advocates
- Staff training improvements: Specific feedback helps target training to address actual customer concerns
- Menu refinement: Direct customer input on food quality and preferences leads to more successful menu updates
- Operational adjustments: Data-driven insights reveal service bottlenecks and pain points
5. Menu Engineering Reports
Menu engineering combines sales data with profitability analysis to categorize menu items as:
- Stars: High popularity, high profit
- Puzzles: Low popularity, high profit
- Workhorses: High popularity, low profit
- Dogs: Low popularity, low profit
This visual matrix helps make strategic decisions about which items to promote, reprice, redesign, or remove. Industry research indicates that such strategies can enhance profit margins by 8-12%
6. Marketing ROI Reports
Tracking the effectiveness of your marketing efforts reveals valuable insights:
- Promotion and coupon redemption rates
- Social media campaign performance
- Email marketing open and conversion rates
- Customer acquisition costs
- Lifetime value of customers from different marketing channels
Integration between your POS and marketing tools allows you to directly attribute sales to specific campaigns, giving you clear ROI metrics for each marketing dollar spent.
7. Table Turnover & Occupancy Reports
Maximizing your seating capacity directly impacts revenue potential:
- Average time guests spend at tables
- Turnover rates by day and time
- Table occupancy percentages
- Reservation show rate vs. no-show rate
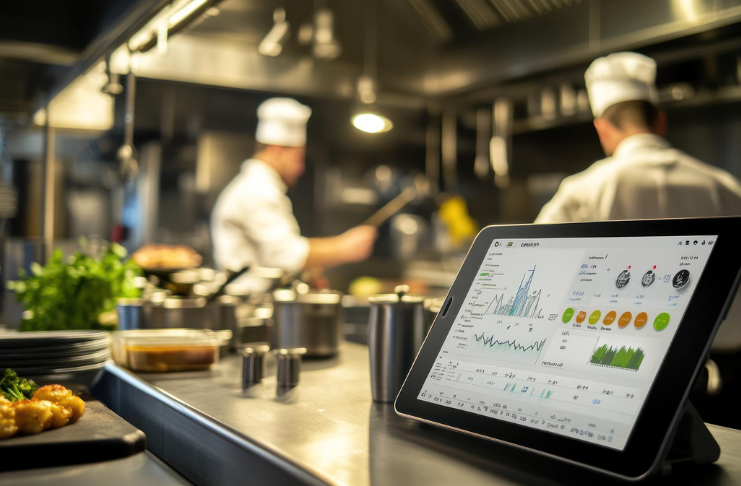
8. Daily Flash Reports
In a world where timing is everything, real-time reporting is the key to staying ahead of the competition. These “at-a-glance” summaries provide critical daily metrics:
- Yesterday’s sales vs. forecast and previous year
- Labor cost percentage
- Cost of goods sold percentage
- Cash discrepancies
- Void and comp statistics
Mobile-accessible flash reports allow managers and owners to stay connected to business performance metrics from anywhere, enabling quicker responses to operational issues.
9. Manager Shift Reports
These handoff documents ensure continuity between shifts:
- Sales numbers for the completed shift
- Staff performance notes
- Inventory issues or 86’d items
- Equipment problems
- Special events or VIP reservations
10. Integrated POS Reporting
Modern point-of-sale systems offer sophisticated reporting capabilities:
- Customizable dashboards for different management roles
- Automatic report generation and distribution
- Exception-based reporting that flags unusual patterns
- Multi-location data aggregation
- Historical data analysis with predictive capabilities
Look for POS systems that offer API connections to your other business tools, allowing for comprehensive data integration across all platforms.
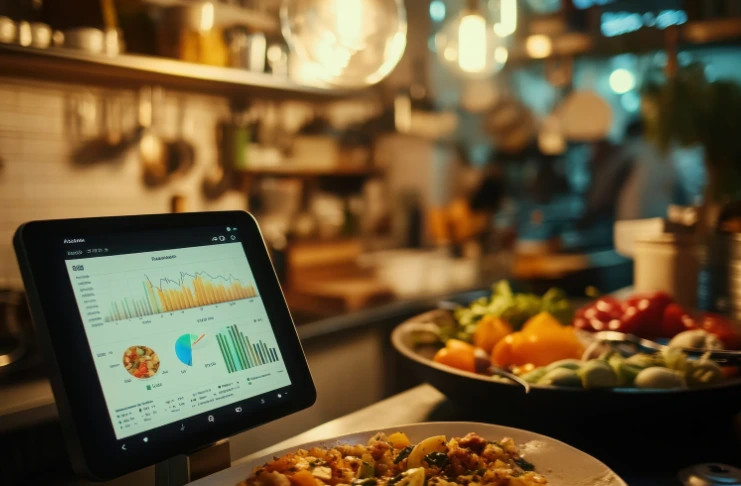
11. Cloud-Based Analytics
Cloud solutions have revolutionized restaurant reporting by the providing insights:
- Access from any device, anywhere
- Real-time data synchronization
- Automatic software updates
- Reduced IT infrastructure costs
- Enhanced data security and backup
Cloud-based restaurant management platforms provide comprehensive reporting suites that integrate all operational data sources into unified dashboards, eliminating the need to reconcile information from multiple systems.
12. Comparative Analysis Reports
These reports provide context for your numbers by comparing:
- Your performance against industry benchmarks
- Current period vs. previous periods
- Actual results vs. budgeted projections
- Location-to-location comparisons for multi-unit operations
- Performance by daypart or meal period
Comparative analysis helps identify not just problems but opportunities—such as underperforming dayparts that represent growth potential.
13. Forecast & Trend Reports
Looking forward is as important as looking back:
- Sales forecasting based on historical patterns
- Seasonal trend analysis
- Labor requirement projections
- Inventory needs predictions
- Cash flow forecasting
14. Owner/Investor Reports
Executive-level reporting focuses on:
- Profit and loss statements
- Return on investment metrics
- Growth trajectory analysis
- Risk assessment indicators
Create executive summaries that highlight the metrics most relevant to strategic decision-making while providing access to supporting details when needed.
15. Manager-Level Reports

Operational leaders need actionable daily insights:
- Labor management tools
- Inventory control metrics
- Staff performance data
- Customer satisfaction scores
- Daily/weekly sales targets and actuals
Automating routine reports saves managers hours each week, allowing them to focus on guest experience and team development instead of spreadsheets.
16. Staff Performance Reports
Individual employee metrics drive accountability:
- Sales per labor hour
- Average check size by server
- Upselling effectiveness
- Tip percentages
- Customer feedback tied to specific staff members
When shared transparently, performance metrics can create healthy competition and motivation among staff members.
17. Predictive Analytics
Forward-looking restaurants are using sophisticated algorithms to drive growth with:
- Predict busy periods with greater accuracy
- Anticipate inventory needs
- Forecast staffing requirements
- Identify potential customer churn
- Recommend personalized marketing approaches
Some restaurant management platforms now incorporate machine learning that becomes increasingly accurate over time, helping predict outcomes based on historical patterns.
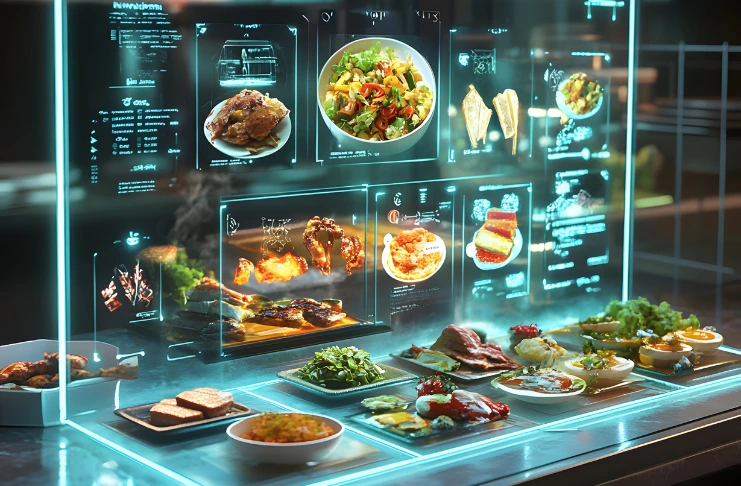
18. Data Visualization Tools
Visual representations make complex data accessible:
- Heat maps showing table utilization
- Traffic flow diagrams for service efficiency
- Color-coded menu performance matrices
- Trend graphs with predictive extensions
- Interactive dashboards with drill-down capabilities
Graphical representations of data can help team members quickly grasp information that might be missed in spreadsheets or text-based reports.
Implementation: From Data to Action
1. Setting Up Effective Reporting Systems
The journey to data-driven operations includes:
- Identifying your most critical KPIs
- Selecting the right technology partners
- Training your team on data interpretation
- Establishing regular review processes
- Creating action plans based on insights
Start small with 5-7 core metrics rather than trying to track everything at once. Master these basics before expanding your reporting scope.
2. Common Reporting Pitfalls to Avoid
Be aware of these frequent challenges:
- Analysis paralysis from too much data
- Focusing on metrics without context
- Inconsistent data collection methods
- Failing to act on the insights revealed
- Neglecting to share relevant data with your team
If you’re generating reports that nobody reviews or discusses, you’re wasting valuable resources and missing opportunities for improvement.
3. Conducting a Reporting Needs Assessment
Before investing in new systems:
- Identify your current reporting gaps
- Determine which metrics matter most to your specific operation
- Consider who needs access to what information
- Evaluate your technical capabilities and limitations
- Calculate the ROI potential of improved reporting
4. Selecting the Right Restaurant Management Platform
When evaluating software options, consider:
- Comprehensiveness of the reporting suite
- User-friendliness of interfaces and dashboards
- Mobile accessibility features
- Integration capabilities with existing systems
- Customization options for your specific needs
5. Creating a Reporting Schedule
Establish regular rhythms for reviewing different types of data:
- Daily flash reports (sales, labor, inventory alerts)
- Weekly operational reviews (detailed performance analysis)
- Monthly strategic assessments (trends, marketing effectiveness)
- Quarterly business reviews (big-picture evaluation)
- Annual planning based on comprehensive data analysis
Schedule specific times for report review and action planning to ensure these critical activities don’t get pushed aside by daily operational demands.
6. Getting Started Today
Begin your path to data-driven success with these steps:
- Audit your current reporting capabilities and identify gaps
- Define your most critical KPIs based on your business goals
- Evaluate integrated restaurant management platforms that can grow with your needs
- Train your team not just on generating reports but interpreting them
- Establish regular review meetings focused on turning insights into action
Conclusion
The restaurants that will thrive in the coming years are those that embrace data not as a burden but as their competitive advantage. Every report has the potential to unlock new efficiency, new revenue, or new customer satisfaction—if you know how to read it and act on it.
Are you ready to transform your restaurant operation with powerful reporting and analytics? The journey from data to success begins with a single step: choosing to make decisions based on facts rather than hunches. Your reports presenting data aren’t just numbers—they’re the story of your business, telling you where you’ve been and helping you chart where you’re going next.
Frequently Asked Questions
1. How do you write a restaurant report?
A restaurant report includes details on sales, customer feedback, staff performance, food quality, and financial metrics. It should be clear, data-driven, and include recommendations for improvement.
2. What is the restaurant performance index?
The Restaurant Performance Index (RPI) is a monthly composite index that tracks the health and outlook of the restaurant industry based on sales, traffic, and expectations.
3. Are restaurant sales down in 2025?
Current restaurant sales trends in 2025 can be checked through industry reports and other financial reports and news. Would you like me to look up the latest data?
4. What does KPI mean in restaurants?
KPI (Key Performance Indicator) in restaurants refers to measurable metrics like sales per table, food cost percentage, customer retention, and employee turnover.
5. When should you complain about a restaurant?
Complain when you experience poor service, incorrect orders, food safety concerns, or unsanitary conditions. It’s best to address issues promptly with the manager.
6. How do I report a restaurant for bad service?
You can report bad service by leaving a review, contacting the restaurant management, or filing a complaint with local health or consumer protection authorities.
7. Do restaurants report tips to the IRS?
Yes, restaurants and employees are required to report tips to the IRS. Employees must declare cash and credit card tips, and restaurants report them on tax filings.
6. What does OSHA do for restaurants?
OSHA (Occupational Safety and Health Administration) sets safety regulations for restaurants, ensuring workplace safety, proper food handling, and preventing hazards like burns and slips.
7. How do restaurants use data analytics?
Restaurants use data analytics to track sales, optimize menus, manage inventory, analyze customer preferences, and improve marketing strategies.
8. What is the difference between analytics and reporting?
Reporting provides historical data summaries, while analytics interprets data to identify trends, make predictions, and improve decision-making.
9. How to do analytics and reporting?
Collect relevant data, use software to generate reports, analyze trends, and apply insights to optimize business operations.
10. What is business analytics and reporting?
Business analytics involves analyzing data to drive decisions while reporting presents structured data summaries for business insights.